The Top 10 States For Green Homes
Washington leads our 2024 "Best States for Green Homes" rankings. This achievement is due to its low energy consumption per household and a high percentage of electricity from renewable sources, leading to reduced CO2 emissions per MBTU. Click on any of the top 10 states below or see the summary of results further down for details!
| Rank | State | Average Annual BTUs Per Household (In Millions) | BTU/Sq Ft, Climate Adjusted (Energy Efficiency) | Energy Mix, Per Household % Electric/Gas/Propane/Fuel Oil | CO2 Emissions Per MBTU | effUSA Score |
|---|---|---|---|---|---|---|
| 1 | Washington | 67.1 | 6.85 | 56%/41%/3%/N/A | 124.3 | 61 |
| 2 | Idaho | 89.2 | 6.24 | 42%/52%/5%/N/A | 145.17 | 59 |
| 3 | Oregon | 67.4 | 7.28 | 56%/41%/2%/N/A | 149.87 | 58 |
| 4 | Vermont | 88.6 | 6.12 | 26%/17%/15%/42% | 156.38 | 57 |
| 5 | South Dakota | 87.1 | 5.22 | 42%/46%/10%/N/A | 158.12 | 56 |
| 6 | New Hampshire | 91.1 | 5.89 | 27%/19%/15%/38% | 178.19 | 54 |
| 7 | Minnesota | 100.3 | 5.93 | 32%/56%/11%/N/A | 186.25 | 53 |
| 8 | Maine | 88.8 | 6.13 | 27%/13%/13%/47% | 188.43 | 52 |
| 9 | Alaska | 125.1 | 6.45 | 20%/59%/1%/20% | 195.5 | 51 |
| 10 | Maryland | 75 | 6.9 | 52%/41%/1%/6% | 197.24 | 50 |
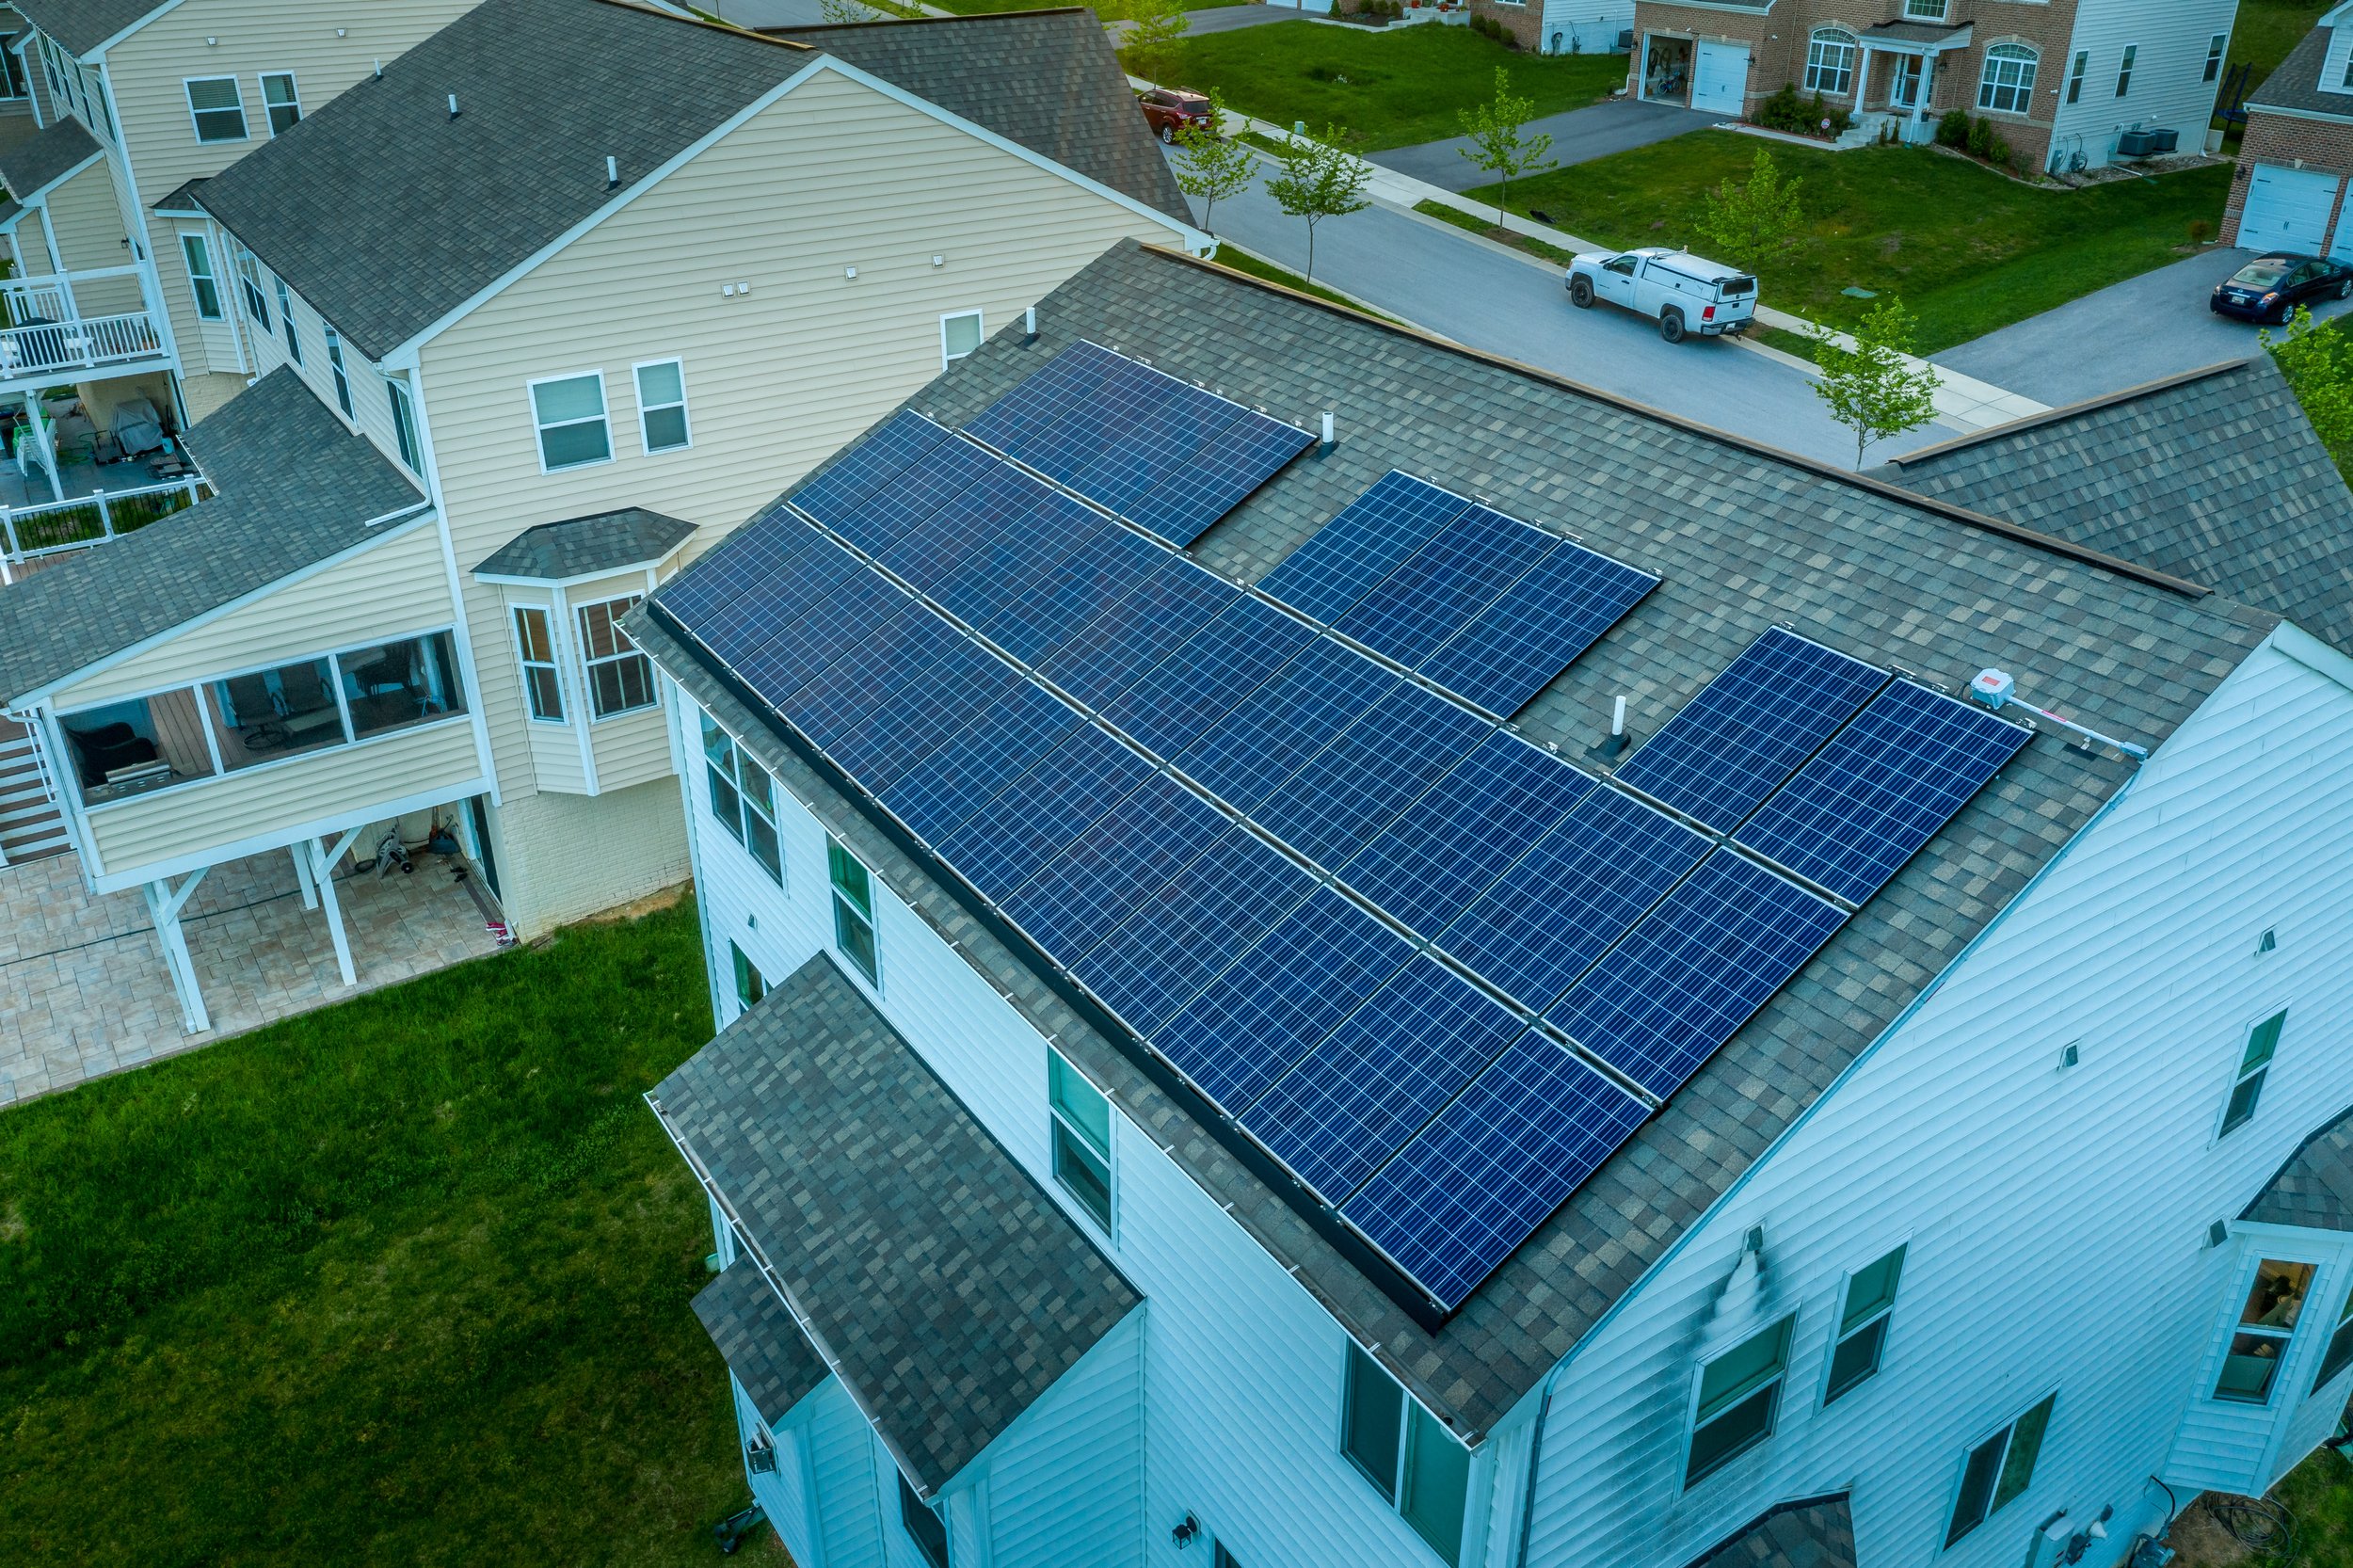
These totals exclude rooftop solar. States with extensive rooftop solar installations should naturally report lower emissions and average BTUs consumed per household. This time there was a noteable exception. California scored in the top 10 for our measure of household CO2 emissions and has one of the lowest annual average BTUs consumed per household - kudos to California! However, it was not in the top half of all states for our measure of energy efficiency, which adjusts the numbers for the state's climate and size of homes to make it a fairer comparison. Only states that were in the top 1/2 for energy efficiency are ranked. For a detailed discussion of methodology, please see Greenest Homes In America: Assessing State Performance.
How We Determined State Scores
1. Initial Filter: Top 25 States For Home Energy Efficiency
Purpose: This filter ensures that only states with superior energy efficiency are considered for a ranking.
Method: We initially ranked all states based on their energy efficiency metrics, average annual household MBTUs consumed in that state, adjusted for climate and size of homes. Then, only the top 25 states in this ranking were considered for the next step.
2. Ranking Criterion: CO2 Emissions per MBTU
Purpose: Among the efficiently performing states, this criterion further distinguishes those that have the lowest environmental impact, carbon emissions related to energy use.
Method: We ranked the filtered top 25 energy-efficient states based on their CO2 emissions per MBTU. Lower emissions per unit of energy consumed indicate a lesser environmental impact, thus a better ranking.
Note: The mix of household sources of energy (electric/gas/propane/heating oil) and the amount of renewable energy used to generate electricity by utilities in that state were both considered for these scores.
Sources:
Average monthly BTUs per household: This data is from the US Energy Information Administration (EIA).Percentage of BTUs consumed from various sources like electric, natural gas and higher emission fuels like propane and home heating oil: This data is also from the EIA.
In-state electric utility power generation by fuel source: This data is also from the EIA.
For further information, please see our press release>>


